
I was reviewing a performance report with a client last year. Mid-size BPO operation, around 600 agents, financial services vertical. The report was 47 pages. It covered average handle time, CSAT scores, QA evaluations, adherence rates, occupancy, first call resolution, sentiment trends, and about a dozen other metrics their platform generated automatically.
When I asked the operations director which of those metrics she actually used to make decisions, she paused.
Honestly, probably three of them.
That is the state of agent performance measurement in most contact centers today. Not a lack of data — an excess of it, poorly connected to the decisions it is supposed to inform. Operations teams are measuring more than ever and acting on less than they should, because the relationship between what gets tracked and what gets decided has never been clearly defined.
Here is how contact centers are measuring agent performance today, what those measurements actually tell you, and where the gaps are that cost operations the most.
The Contact Center Performance Measurement Stack
Agent performance measurement in a modern contact center is not a single system or a single scorecard. It is a stack of overlapping data sources: quality evaluations, operational metrics, customer feedback, and behavioral analytics. Each layer captures a different dimension of what an agent does and how customers respond to it.
The problem most operations have is not that any individual layer is wrong. It is that the layers do not connect. A QA scorecard showing an agent scoring 88 on quality evaluations while their CSAT sits at 3.2 out of 5 is telling you something important — there is a gap between what your evaluation criteria measure and what customers actually experience. But most operations look at those numbers in separate reports, on separate timelines, managed by separate teams. The signal gets lost.
Understanding what each layer measures, what it misses, and how it connects to the others is the starting point for building a measurement approach that actually informs decisions.
QA Scorecards: The Foundation With the Most Variables
Quality assurance scorecards are the most direct measurement of agent behavior during interactions. They evaluate whether an agent followed required processes, communicated effectively, handled the customer’s issue appropriately, and met compliance requirements. Done well, they are the most actionable data in your performance stack. Done poorly, they measure compliance with a rubric that has drifted out of alignment with what actually produces good customer outcomes.
The rubric design problem is more common than most quality directors want to acknowledge. Evaluation criteria get established during program setup, weighted according to what seemed important at the time, and then persist through operational changes, regulatory updates, product launches, and customer expectation shifts that never get reflected in the scorecard. I have audited QA programs where 30% of the evaluation criteria were measuring behaviors that no longer reflected current operating standards. Agents were being coached against criteria that had been functionally obsolete for over a year.
Scoring consistency compounds rubric problems. Two evaluators applying the same rubric to the same interaction will score it differently if they have not been calibrated recently. In large BPO operations with multiple QA analysts, scoring variance across evaluators is a persistent problem that undermines the reliability of individual agent scores and makes trend analysis unreliable.
Sampling coverage determines how much the scorecard data actually represents agent performance. The traditional 2% to 5% random sample gives each agent five to ten evaluated interactions per month. That is enough to catch obvious outliers. It is not enough to identify consistent patterns, distinguish a bad week from a genuine performance issue, or build coaching conversations on a representative picture of what an agent actually does. Platforms that have moved to 100% automated scoring changed this equation entirely.
What QA scorecards tell you well: whether agents are meeting defined process and compliance standards, where specific skill gaps exist, and how performance trends over time as coaching interventions are applied. What they do not tell you: whether your defined standards are the right ones, or whether meeting those standards translates to customer outcomes that matter to your business.
CSAT: The Customer’s Vote, With Important Caveats
Customer satisfaction scores are the metric most contact center leaders feel accountable for and the metric most vulnerable to factors outside agent control. That tension shapes how CSAT should be interpreted and what operational conclusions can reasonably be drawn from it.
The measurement itself varies across operations in ways that make comparisons unreliable. Post-call IVR surveys, email surveys sent 24 hours after contact, in-app ratings, and agent-solicited feedback all measure different things at different points in the customer experience. Response rates are typically low, running 10% to 20% for most channels.
Attribution is the harder problem. A customer who rates an interaction poorly may have been dissatisfied with the agent’s handling of the issue, the company’s policy, the wait time before reaching the agent, a billing error that preceded the call, or a product failure that triggered the contact. Agents get coached on CSAT scores that reflect policy frustration more than service quality. That is both unfair to the agent and operationally useless.
The relationship between QA scores and CSAT is worth measuring explicitly. Operations where high QA scores correlate strongly with high CSAT have evidence that their evaluation criteria are measuring the right things. Operations where that relationship is weak have evidence that their rubric is measuring process compliance rather than customer experience quality. That gap is one of the most important diagnostic findings a quality program can surface.
First Call Resolution: The Contact Center Metric That Predicts the Most
First call resolution — whether a customer’s issue was resolved without requiring a repeat contact — is the single metric most consistently correlated with customer satisfaction, operational cost, and agent effectiveness. It is also one of the harder metrics to measure accurately.
The definition problem comes first. Some operations use agent-reported resolution, some use repeat contact within a defined window, some use customer-confirmed resolution from a post-call survey. Each definition produces different numbers. An operation reporting 78% FCR using agent disposition codes and 62% FCR using 7-day repeat contact rates has not changed its operational reality. It changed its measurement approach.
FCR by call type is more useful than aggregate FCR. An operation with 74% overall FCR might have 91% FCR on straightforward account inquiries and 48% FCR on billing disputes. Those two numbers require completely different responses. The billing dispute FCR is a process design problem more than an agent performance problem. You can coach agents individually until you have exhausted your coaching capacity and the number will not move if the underlying process is broken.
Average Handle Time: The Metric Everyone Tracks and Most Misuse
Average handle time is the most universally tracked metric in contact center operations and one of the most consistently misapplied. It is a proxy metric. It does not measure quality or customer experience directly. It measures time, and time has an ambiguous relationship with both.
Short handle times can reflect agent efficiency or agent avoidance. An agent consistently 90 seconds below team average AHT might be excellent at issue resolution. They might also be ending calls before issues are fully resolved, producing a short handle time today and a repeat contact tomorrow. Without connecting AHT to FCR and CSAT at the agent level, you cannot distinguish between the two.
The operational use of AHT that consistently produces value is AHT by call type, tracked at the agent level, and connected to other performance metrics rather than evaluated in isolation. A specific agent who is three minutes above team average on a specific call type, with FCR below team average on that same call type, is telling you something coherent about a skill or knowledge gap worth addressing.
Targets for AHT reduction need to be set at the call type level, not as blanket operational goals. Pushing overall AHT down without accounting for call type complexity produces the wrong behaviors: agents shortening complex interactions that needed more time while the target comes down on paper.
Sentiment Analysis in Contact Centers: What It Adds to the Performance Picture
Sentiment analysis has moved from a niche capability to a standard feature in most enterprise quality monitoring platforms, and the operational value varies significantly depending on how it gets used.
The capability adds a dimension that traditional QA scoring does not capture. An agent can follow every step of a rubric, hit every required phrase, and still produce an interaction where the customer feels dismissed or unheard. Sentiment analysis surfaces that gap.
Agent sentiment is an underused measurement dimension in most operations. Detecting indicators of agent stress, disengagement, or frustration during interactions has direct relevance to both performance management and workforce health. An agent whose sentiment indicators shift negative over a period of weeks is giving you early visibility into a burnout or engagement problem that is considerably easier to address before it shows up in attendance or attrition data.
Useful sentiment measurement is segmented by call type, trended over time, and connected to outcomes. A rising negative sentiment trend on a specific call type across multiple agents points at a process or product problem, not an agent performance problem.
Coaching Effectiveness: The Contact Center Measurement Most Operations Skip
Here is the gap I see in almost every operation I work with. They measure agent performance thoroughly, measure coaching activity inconsistently, and almost none of them measure whether coaching actually changes anything.
Coaching activity measurement — counting sessions conducted, completion rates, topics covered — is not the same as coaching effectiveness measurement. An operation where every agent receives two coaching sessions per month and performance scores do not improve is running an active but ineffective coaching program.
Coaching effectiveness measurement requires connecting specific coaching interventions to subsequent performance changes at the agent level. An agent who receives coaching on compliance language adherence on a specific date should show a measurable change in compliance scores on that topic in subsequent evaluations.
Operations that build coaching effectiveness tracking into their quality program get two things most operations do not have: visibility into which supervisors are developing agents effectively and which are not, and evidence for what coaching approaches actually produce performance improvement.
Building a Contact Center Performance Measurement Framework That Actually Works
The 47-page report is not a measurement success. It is a measurement accumulation problem. Data that does not connect to decisions is not an asset — it is noise that makes the signals harder to find.
A measurement framework that works starts with the outcomes you are accountable for and works backward to the metrics that predict and explain those outcomes. If you are accountable for CSAT, you need metrics that explain CSAT variance: FCR by call type, sentiment patterns, QA score correlation with survey results.
Every metric on your performance dashboard should connect to at least one decision your team makes or one action it triggers. If a metric sits in a report that gets reviewed monthly and never produces a defined response, either the metric is not measuring the right thing or the operational workflow to act on it does not exist. Both are fixable. Neither fixes itself.
The practical test: for each metric you currently track, ask what decision changes or what action gets triggered when that number moves. If the answer is ‘we note it and watch it,’ you have a reporting metric, not a management metric.
QEval™ connects quality evaluation, coaching workflow, and performance tracking in a single platform, so the relationship between what agents do in interactions, what supervisors do in coaching conversations, and what changes in performance outcomes is visible and measurable. Visit etslabs.ai to see how that applies to your operation.
For BPO operations looking at how enterprise-grade quality programs are structured end to end, Etech Global Services has been running contact center operations at scale for over 25 years across multiple verticals. Visit etechgs.com to learn more.
Frequently Asked Questions: Contact Center Agent Performance Measurement
What metrics are used to measure agent performance in a contact center?
The core metrics are QA scorecard scores, customer satisfaction (CSAT), first call resolution (FCR), average handle time (AHT), and sentiment analysis. The most effective operations connect all five rather than reviewing them in separate reports.
What is a good QA score for a contact center agent?
Most operations target 85% to 90% on QA evaluations, but the target is less important than whether the rubric is current and whether high QA scores correlate with high CSAT. A high QA score against an outdated rubric provides no operational value.
How do you measure coaching effectiveness in a contact center?
Coaching effectiveness is measured by connecting specific coaching interventions to performance changes at the agent level on the exact skills addressed. Counting coaching sessions completed is a measure of activity, not effectiveness.
What is first call resolution and why does it matter?
First call resolution measures whether a customer’s issue was resolved without a repeat contact. It is the metric most consistently correlated with customer satisfaction and cost per contact. Operations should track FCR by call type, not just as an overall aggregate.
How does sentiment analysis improve contact center QA?
Sentiment analysis detects gaps that traditional QA rubrics miss — specifically, interactions where an agent followed the process but the customer still felt unheard. It also provides early indicators of agent engagement and burnout before those issues surface in attrition data.

Related Posts
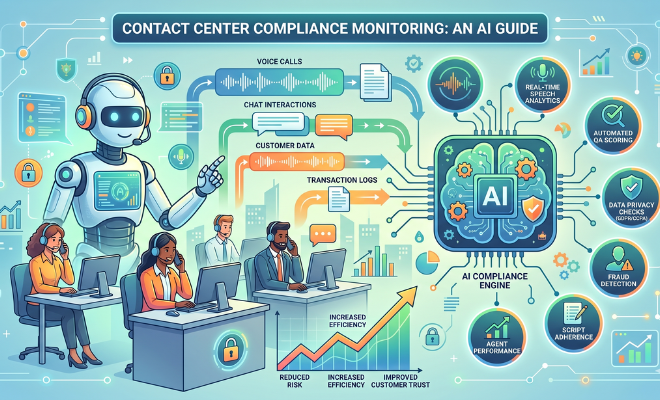
Contact Center Compliance Monitoring: An AI Guide
Sample-based audits miss 99% of calls. Learn how AI compliance monitoring covers PCI-DSS, HIPAA &…
Read More
Enterprise Live Chat For Contact Centers: Build vs Buy
Build, buy, or configure? A practical framework for enterprise live chat — covering omnichannel integration,…
Read MoreContact Us
Let’s Talk!
Choose Services