
Customer journey is one of the most searched concepts in customer experience, and also one of the most misunderstood. Most organizations have a journey map somewhere — built in a workshop, printed on a whiteboard, maybe turned into a slide deck. Far fewer have a way to measure whether the journey they mapped is the journey customers are actually experiencing. That gap between the intended journey and the actual journey is where most CX programs quietly fail.
This guide covers what a customer journey actually is, how to map it, how to measure it with real data, the failure modes that undermine most journey programs, and how to turn journey insight into operational change.
What Is a Customer Journey?
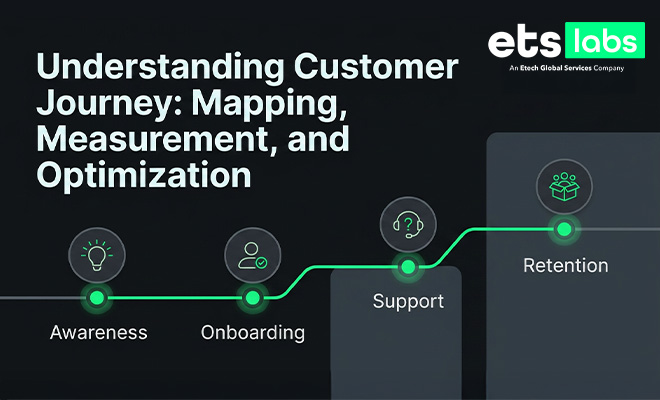
A customer journey is the full sequence of interactions a customer has with your organization across every touchpoint and channel — from initial awareness through consideration, purchase, onboarding, ongoing support, and retention or advocacy. It’s a strategic framework, not a marketing artifact.
The most important distinction in journey work is between the intended journey — what your organization designed — and the actual journey — what customers experience and what your data shows. These two rarely match perfectly. A customer might skip stages, loop back, switch channels mid-process, or take a path nobody anticipated. Every contact center operates inside this larger journey context, whether or not that context is visible to frontline teams, and understanding it changes how you interpret operational metrics like handle time or first-contact resolution.
Mapping Your Customer Journey
Good journey mapping starts with personas, not touchpoints. A new customer’s journey looks different from an existing customer’s; an enterprise buyer’s journey looks different from a self-service consumer’s. Mapping a single generic journey for all customer types produces a map nobody finds useful.
Once personas are defined, identify every touchpoint a customer might use — phone, chat, email, social media, self-service web portals, and in-person interactions where relevant. For each stage of the journey, document what happens, how long it typically takes, and what a successful outcome looks like.
Pay particular attention to handoffs — the points where a customer moves from one channel, team, or system to another. Handoffs are where journeys break down most often: information doesn’t transfer, context is lost, and the customer has to repeat themselves.
Throughout the mapping process, keep the distinction between intended and actual journey front of mind. A map built purely from internal assumptions about how the process should work is a hypothesis, not a fact. The next step — measurement — is what turns that hypothesis into something reliable.
Mapping tools don’t need to be sophisticated. A structured matrix showing stage, channel, responsible team, and expected outcome is often more useful than an elaborate visual, because it’s easier to update and easier to connect to data later.
Measuring the Customer Journey
The single biggest failure in journey programs is the single-metric trap: tracking one score, like NPS or CSAT, and assuming it represents the whole journey. A single relationship-level score can’t tell you where in the journey things are going right or wrong.
Effective journey measurement looks at each stage individually. Track completion rate, time spent, and outcome quality at every stage rather than only at the end. An onboarding stage, for example, might be measured by time to first successful interaction, number of questions resolved per interaction, and repeat-contact rate within the first thirty days.
Measurement also needs to span channels. If a customer starts a conversation in chat and finishes it on a phone call, does your data treat that as one journey or two disconnected interactions? Omnichannel consistency is easy to claim and hard to verify without measuring it directly — and without that measurement, channel-switching customers often disappear from the data entirely.
Handoff quality deserves its own measurement lens. Where do customers drop off? At what stage does friction spike? Handoff failures are often invisible in aggregate metrics but show up clearly when you isolate the transition points between stages or channels.
None of this is complete without interaction-level data. Call recordings and transcripts show what actually happened during each conversation — what was said, what was resolved, and where the interaction went off track. Surveys and completion metrics tell you the outcome; interaction data tells you why that outcome occurred. Journey measurement that relies only on outcome metrics, without the underlying interaction detail, will always leave the most important question — why — unanswered.
Finally, connect journey metrics back to business outcomes. Faster resolution at the support stage, higher retention following a strong onboarding experience, and increased cross-sell following a well-handled service interaction are the kinds of connections that turn journey data into a business case leadership will act on.
Common Journey Measurement Failures
A few recurring mistakes account for most underperforming journey programs.
Measuring only the endpoint — the final interaction in a customer’s journey — rather than the full sequence that led there misses the context that explains why the endpoint looked the way it did. A customer who churns after one bad call may have had three prior friction points that never showed up in any report.
Ignoring repeat contacts is another common blind spot. When a customer contacts you multiple times during the same journey stage, that’s a direct signal of unresolved friction, not simply higher engagement.
Channel siloing — measuring voice, chat, and email as separate, unconnected data sets — hides customer behavior that crosses channels, which is now the norm rather than the exception.
Journey data that isn’t connected to operational quality data is incomplete. A journey map can show that customers struggle during onboarding, but without call scoring or quality data layered in, there’s no way to know whether the cause is a process gap, a knowledge gap, or an agent performance issue.
And assuming the journey is uniform across customer segments — enterprise, mid-market, and consumer, for example — leads to generic interventions that fit none of them well.
Optimizing Based on Journey Insights
Once measurement is in place, optimization follows a straightforward pattern: identify friction points, test interventions, measure impact, and scale what works.
Start by identifying which stages show the longest resolution times, the lowest satisfaction scores, or the highest repeat-contact rates — these are your priority areas. From there, test specific interventions: reducing transfers, improving first-call scripting, or tightening the handoff process between teams.
Measure the impact of each change directly against the baseline you established. Did the intervention actually reduce stage time or improve the outcome, or did it just feel like an improvement anecdotally? This is where the connection between quality monitoring and journey measurement becomes valuable — if quality scoring shows agents consistently missing key onboarding questions, that’s a specific, actionable coaching opportunity rather than a vague process concern.
Take an iterative approach. Optimize one stage, confirm the result, then move to the next rather than attempting to overhaul the entire journey simultaneously. And when something works — a coaching intervention that improves onboarding outcomes, for instance — scale it deliberately across the full agent population rather than leaving it as a one-off success.
Journey and Channel Strategy
Modern customer journeys are inherently omnichannel. A customer might discover your brand through social media, research on your website, purchase over the phone, onboard through email, and seek support through chat. Each stage often has a different natural channel preference, and forcing a single channel across the whole journey creates friction rather than removing it.
The integration requirement here is real: customer history has to follow the customer across channels, or every handoff becomes a fresh start where the customer repeats context they’ve already provided. And from a measurement standpoint, the key question is whether cross-channel interactions are tracked as a single connected journey or as separate, disconnected events. Organizations that get this wrong consistently underestimate friction, because the data itself is fragmented in the same way the customer’s experience is.
Building the Measurement Infrastructure
None of the practices above work without infrastructure that can actually connect journey stages to interaction data at scale. In smaller operations, a spreadsheet and a shared understanding among a small team can substitute for formal systems. That approach breaks down quickly as interaction volume grows, as channels multiply, and as teams become distributed across locations or outsourced partners.
At scale, journey measurement requires three things working together: a system of record for customer history that persists across channels, a way to capture and structure interaction-level data (recordings, transcripts, chat logs) for every touchpoint, and a reporting layer that can roll individual interactions up into stage-level and journey-level metrics without losing the ability to drill back down into specific interactions when something needs investigation.
Organizations often build the first piece — the CRM or customer data platform — early, because it’s foundational to sales and service operations generally. The second and third pieces are where most journey programs stall, because capturing and structuring interaction data at 100% coverage, across every channel, has historically required either significant manual effort or accepting a small sample and extrapolating from it. Neither option scales well, which is why journey programs at high-volume contact centers increasingly pair journey mapping with automated, full-coverage interaction analysis rather than treating quality monitoring and journey measurement as separate initiatives.
Bringing Journey Insight Into Operations
Customer journey mapping, measurement, and optimization together create a genuine competitive advantage — but only when the measurement half of that equation is taken as seriously as the mapping half. You can’t optimize what you don’t measure, and data from actual customer interactions is the only reliable source of truth for what’s happening at each stage, not the assumptions baked into the original map.
Understanding a journey ultimately requires understanding each individual interaction within it — what was said, how it was handled, and what the outcome was. That’s the level of detail that turns a journey map from a strategic exercise into an operational tool.
It’s also worth being honest about timeline. Building a genuinely data-driven journey program — one that spans mapping, cross-channel measurement, and interaction-level detail — is not a quarter-long project for most organizations. It typically involves an initial mapping phase, a measurement buildout phase where data sources are connected and baselined, and an ongoing optimization cycle that never really ends, because customer behavior and channel preferences keep shifting. Treating journey work as a one-time mapping exercise, rather than an ongoing measurement discipline, is itself one of the more common reasons these programs lose momentum after the first year.
If you’re mapping your customer journey using the framework above, the natural next step is connecting that map to interaction-level measurement — which is exactly where a platform like QEval® fits, giving you structured visibility into every interaction across the journey rather than a sample, so the actual journey and the intended journey can finally be compared side by side.
Frequently Asked Questions
What’s the difference between a customer journey map and journey analytics?
A journey map is a designed hypothesis of how customers move through your organization. Journey analytics uses actual interaction and operational data to show what customers really do — which often diverges from the map in specific, measurable ways.
How many touchpoints should a customer journey map include?
As many as customers actually use — typically phone, chat, email, social, self-service web, and in some industries in-person. The goal isn’t touchpoint count; it’s making sure no channel a customer actually uses is invisible to your map or your measurement.
What’s the biggest sign a journey measurement program is failing?
Repeat contacts within the same journey stage that nobody is tracking. If customers are calling back multiple times during onboarding or support and that pattern isn’t visible in reporting, the measurement program has a blind spot at exactly the point where friction is highest.
Do we need interaction-level data, or are journey completion metrics enough?
Completion metrics tell you what happened at a stage; interaction-level data tells you why. A platform like QEval® that scores 100% of voice and digital interactions makes it possible to connect a journey-stage problem back to the specific conversations driving it.
How does ETS Labs support omnichannel journey measurement?
ETS Labs builds QEval® and ICE to capture and score interactions consistently across voice, chat, and digital channels, so cross-channel customer journeys can be measured as one connected sequence rather than fragmented, siloed data sets.

Related Posts
Customer Feedback Surveys Explained: Strategy, Implementation, and Impact Measurement
A practitioner’s guide to customer feedback surveys — types, strategy, implementation, and how to turn…
Read More

What RPA Can’t Automate, and Where Intelligent Automation Fits
RPA fails on 30-50% of initial projects, mostly on exceptions and unstructured data. See where…
Read More

Contact Us
Let’s Talk!
Choose Services