
Model prices have fallen roughly 280-fold since 2022. Enterprise AI bills went up anyway. The difference is architecture.
What is LLM cost optimization for enterprises?
LLM cost optimization is the engineering practice of reducing total inference, retrieval, and orchestration costs in production LLM deployments without degrading task accuracy, latency, or compliance posture. It operates at the architecture layer, not the vendor contract layer, and it requires per-call instrumentation before any structural change is made.
KEY TAKEAWAYS
- This is an architecture problem, not a pricing problem. Per-token prices fell about 280x from 2022 to 2024 (Stanford AI Index), yet enterprise LLM API spend more than doubled in the first half of 2025 alone (Menlo Ventures). Usage growth outruns price declines; only architecture controls the bill.
- Gartner predicted at least 30% of generative AI projects would be abandoned after proof of concept by end of 2025, with escalating costs among the four causes. The scale-up phase is where programs die.
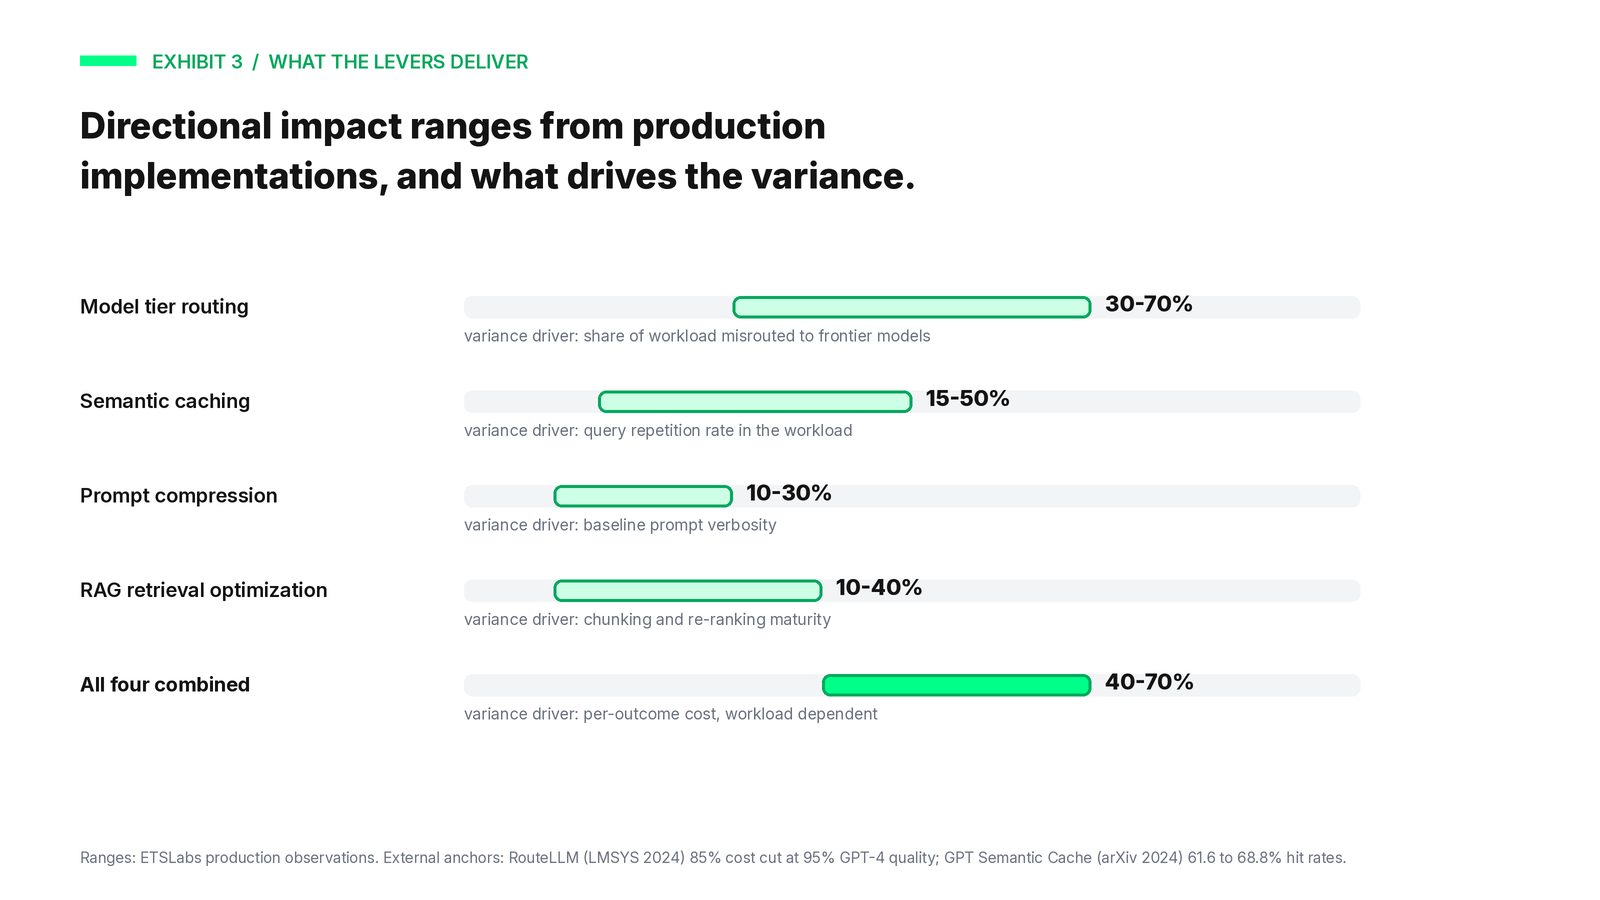
- The four levers are model tier routing, semantic caching, RAG retrieval optimization, and prompt compression. Each is independent, incrementally deployable, and externally validated in published research.
- Cost-per-outcome, not cost-per-call, is the metric a business sponsor can validate. Organizations implementing all four layers typically see measurable per-outcome reduction within 60 to 90 days.
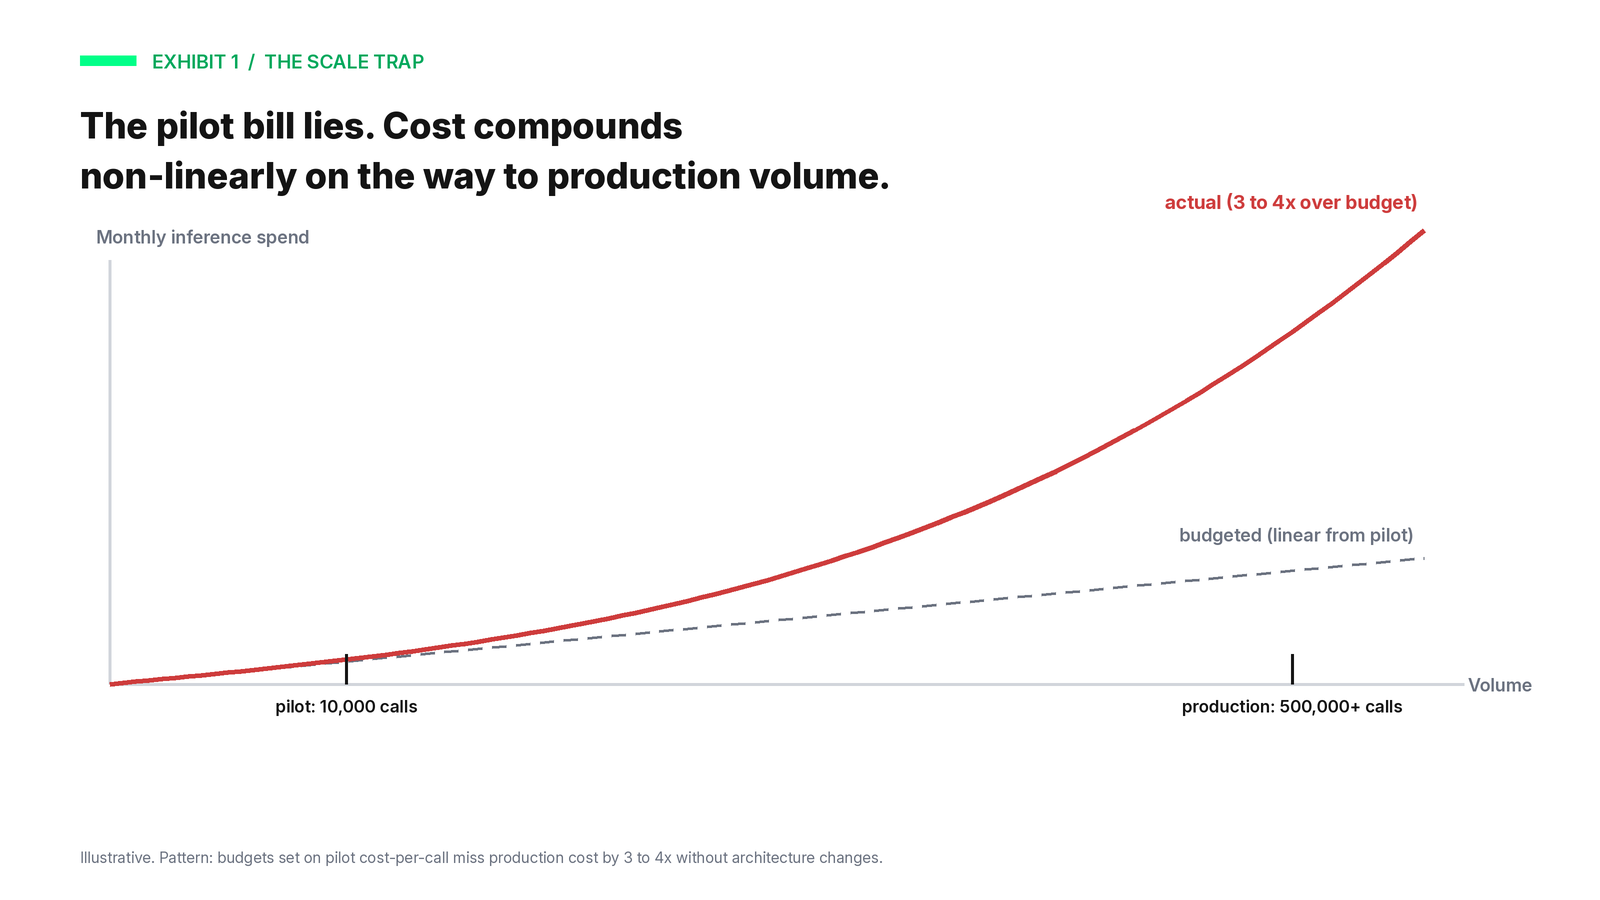
Most enterprise AI programs go through two phases: getting the technology to work, then affording to run it at production scale. The second phase is where programs stall. Inference costs that were manageable at pilot volume compound when monthly interaction counts reach 500,000 or more; a cost that looked acceptable across 10,000 test calls can exceed budget by three to four times at production scale with no change in the model or the task.
The market data confirms how common this is. Gartner predicted in mid-2024 that at least 30% of generative AI projects would be abandoned after proof of concept by the end of 2025, citing poor data quality, inadequate risk controls, unclear business value, and escalating costs. Meanwhile enterprise spend keeps climbing: Menlo Ventures measured LLM API spend more than doubling from $3.5 billion to $8.4 billion in the first half of 2025. Falling token prices do not save you when volume and ambition grow faster, and a16z has documented per-token prices falling roughly 10x per year for constant quality. The bill is an architecture output, not a rate card output.
Market context: Gartner press release, July 2024; Menlo Ventures mid-year 2025 LLM market update; a16z, LLMflation, November 2024; Stanford AI Index 2025. Not ETS Labs data.
Where the overruns actually originate
1. Task-model mismatch. Routing frontier-tier models to tasks smaller models handle fully is the most common avoidable cost. Call classification, topic tagging, and quality rubric scoring are tasks where a domain-fine-tuned smaller model performs comparably at a fraction of the per-token price. The pattern is externally validated: the RouteLLM work from LMSYS and UC Berkeley showed routing between model tiers cut costs by over 85% on MT-Bench while preserving 95% of GPT-4 performance, using GPT-4 on only about a quarter of calls.
2. Context window inefficiency. Prompts that carry full conversation history or unranked retrieval results inflate token counts on every call. A 20% prompt inflation rate, common in first-generation RAG deployments, produces material overrun at production volume. Microsoft Research’s LLMLingua line of work demonstrates how much slack exists here: up to 20x prompt compression with minimal measured performance loss on reasoning benchmarks.
3. Unmetered agentic chains. Multi-step workflows that invoke the LLM at every decision node, where deterministic logic would do, generate inference calls that conditional routing eliminates outright.
External anchors: RouteLLM (LMSYS/UC Berkeley, 2024, ICLR 2025); LLMLingua (Microsoft Research, EMNLP 2023 / ACL 2024).
The four-layer architecture
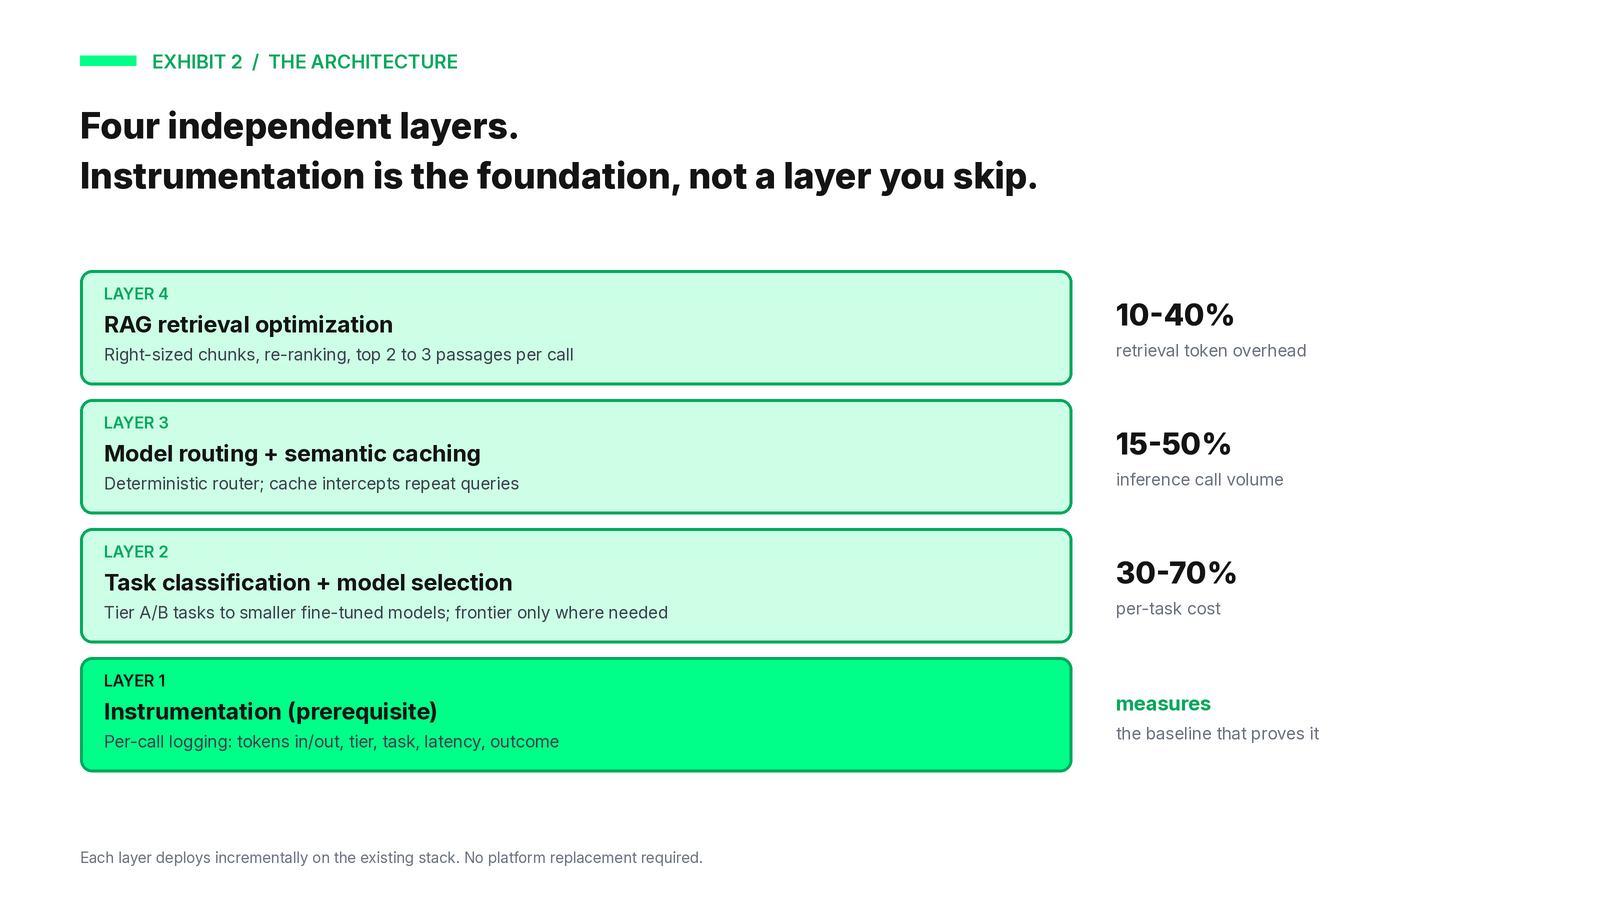
The framework operates across four independent layers. Instrumentation comes first because it generates the data every other layer depends on. ETS Labs applies this framework across enterprise deployments; QEval alone has scored more than 3 billion conversations in 2026 to date, so these are production constraints, not lab conditions.
Layer 1: Instrumentation
Before touching model selection, caching, or retrieval, deploy per-call logging that captures input tokens, output tokens, model tier, task type, latency at P50 and P95, and call outcome. Without this baseline every optimization decision is unvalidated: you cannot confirm a change reduced cost, and you cannot confirm it did not degrade accuracy. ETS Labs production systems maintain sub-300ms response times at enterprise volume because instrumentation was built into the pipeline from day one rather than retrofitted after a cost problem surfaced.
Layer 2: Task classification and model selection
Classify tasks into three tiers before routing. Tier A covers classification, tagging, and rubric evaluation, candidates for smaller fine-tuned models. Tier B covers moderate reasoning suited to mid-tier models. Tier C covers complex generation that needs frontier capability, and in most contact center workloads it is the minority of volume. Domain-fine-tuned small models outperform frontier models on Tier A tasks when training data matches the inference distribution; at a million or more monthly calls, the routing differential typically pays back a fine-tuning investment within three to six months.
This is not a theoretical position for us. QEval is built as a Mixture-of-Experts architecture: purpose-trained expert sub-models per scoring dimension with deterministic routing between them, running 326 million classifications every five minutes. That is Layer 2 applied as a platform design principle rather than a cost patch, and it is why a general-purpose frontier model on every scoring task was never the economics we had to escape.
Layer 3: Model routing and semantic caching
The router itself is a deterministic rule engine directing each call to its tier; no ML required, and in regulated environments every routing decision is logged for audit. Semantic caching intercepts high-repetition queries at the vector-similarity layer before they reach the inference endpoint. Policy questions, billing inquiries, and account status queries repeat constantly. In our production deployments, structured contact center workloads support 35 to 50% cache hit rates; published research on customer-service-style workloads reports hit rates up to 68.8% with positive-hit accuracy above 97%.
Two provider-level mechanisms belong in the same layer and are routinely left unused. First, provider-side prompt caching: major APIs discount cached input tokens steeply (Anthropic prices cache reads at roughly a tenth of base input cost), but only if prompts are structured with stable prefixes, system instructions and rubric definitions first, volatile conversation content last. Most first-generation prompt templates interleave the two and forfeit the discount. Second, batch endpoints: OpenAI and Anthropic both price asynchronous batch processing at half the synchronous rate. Contact centers are unusually well positioned to exploit this because their single largest inference workload, post-call quality scoring, is latency-tolerant by nature. A call scored forty minutes after it ends is worth the same as one scored in forty seconds, at half the price.
External anchors: GPT Semantic Cache, arXiv 2411.05276, November 2024; provider pricing per Anthropic and OpenAI published API documentation.
Layer 4: RAG retrieval optimization
First-generation RAG passes unranked top-K chunks into the context window on every call, inflating tokens without improving answers. Production RAG makes three changes: right-size chunks instead of passing full documents (commonly recommended ranges run 256 to 512 tokens for precision retrieval, though LlamaIndex’s own published evaluation favored 1,024; tune against your workload rather than adopting anyone’s number), re-rank so only the top two to three passages reach the model, and expand queries to eliminate redundant retrieval calls. Re-ranking is the best-evidenced lever: Anthropic’s contextual retrieval work measured a 49% reduction in retrieval failure rate from contextual embeddings, rising to 67% when combined with re-ranking.
External anchors: Anthropic, Contextual Retrieval, September 2024; LlamaIndex chunk-size evaluation; Pinecone two-stage retrieval guidance.
The fifth lever: knowledge graphs at the retrieval layer
There is a structural version of the retrieval problem that chunk tuning cannot fix. When the answer to a question lives across several records (a customer, their account, a transaction, the incident that delayed it), vector search has to retrieve broadly and hope the model assembles the connection. Broad retrieval means fat context windows, and fat context windows are exactly the token inflation Layer 4 exists to fight.
A knowledge graph attacks the same cost from the other side. Instead of retrieving more text and letting the model search inside the prompt, the graph stores entities and their relationships explicitly, so a multi-hop question resolves as a short path traversal: customer to account to transaction to incident. The model receives a handful of connected facts instead of pages of maybe-relevant passages. Fewer tokens in, and fewer retry calls when the first retrieval missed.
The evidence here is promising but honest reading matters. HippoRAG (NeurIPS 2024) combined an LLM-built knowledge graph with graph search and reported up to 20% improvement on multi-hop question answering at materially lower cost and latency than the iterative-retrieval baseline it tested. A 2026 AWS and Cisco study found that context optimization on graph-retrieved evidence cut token usage by 19 to 53% in the configurations tested. The same study also found that a simple one-hop relationship setup beat a more elaborate GraphRAG configuration, and independent benchmarks flag context explosion, where the graph returns too much connected material, as a real failure mode. A graph is a cost lever only when the retrieval it feeds is disciplined.
The practical guidance for contact center workloads: route by question shape. Single-passage lookups stay on vector retrieval and the semantic cache. Relationship questions (why is this refund pending, did yesterday’s release cause this spike) route to graph retrieval, where the token savings and the accuracy gains stack. Treat the graph like every other layer in this framework: instrument it, baseline it, and let cost-per-outcome decide how far to take it.
External anchors: HippoRAG, NeurIPS 2024; Is GraphRAG Needed?, AWS/Cisco 2026; GraphRAG-Bench. Directional findings, workload dependent.
Is your organization ready?
| Criteria | Readiness threshold |
| Monthly LLM call volume | 100,000+ monthly calls: optimization produces material savings |
| Instrumentation | No per-call logging means start at Layer 1; it is the prerequisite |
| Task classification | All calls on one model tier indicates a strong routing ROI case |
| RAG status | First-generation RAG without retrieval tuning is a high-probability win |
| Semantic caching | None in place: 35 to 50% hit rates achievable on structured workloads |
| Engineering capacity | No dedicated AI infrastructure resource: consider embedded support |
Scoring: 0 to 2 criteria met, begin at Layer 1 only. 3 to 4, close the identified gaps first. 5 to 6, strong candidate for full implementation within 30 to 90 days.
How to measure results at 90 days
Measure against a documented pre-deployment baseline, not vendor benchmarks. Two metric categories apply, and both are required: cost efficiency and outcome preservation. Reducing cost while degrading accuracy is not optimization; it is a different kind of failure.
| Metric | What to measure against |
| Cost per outcome | Pre-optimization cost per scored interaction, resolved call, coaching event |
| Cost per call by tier | Pre-optimization baseline per tier, tracked monthly by task type |
| Cache hit rate | Target 35 to 50% on structured contact center workloads |
| Routing accuracy | Percentage of calls correctly tiered; target above 95% |
| Latency P95 | Baseline before changes; confirm no regression after each layer |
| QA scoring cost per interaction | Pre-optimization; confirm net positive after routing overhead |
Five implementation risks to anticipate
1. Accuracy regression after downtiering. Mis-scored evaluations and wrong agent guidance do not surface immediately. Run a 30-day parallel evaluation before decommissioning any frontier-model task type.
2. Cache hit rate decay. A 40% hit rate at launch can fall to 15% within six months as query diversity grows. Track it as a standing KPI and reindex quarterly.
3. Compression masking prompt quality problems. Cost can fall while error rates hold or rise. Audit prompt quality before compression work begins; fix instruction clarity first.
4. Optimization versus explainability. Reduced retrieval context can lower decision traceability, a compliance exposure in regulated environments. Map each optimization against governance requirements and preserve per-call audit logs regardless of compression.
5. Premature release. Remediating a production incident costs more than the optimization saved. Validate each layer in staging at production-representative volume.
On the regulatory clock: the EU AI Act’s Article 50 transparency obligations apply from August 2, 2026, including disclosure when customers interact with AI systems. Documentation of routing decisions, scoring methodology, and per-call audit trails should be built into deployment, not reconstructed for an audit.
Regulatory status as of July 2026. Context, not legal advice.
A decision framework
LLM cost optimization begins with instrumentation, proceeds through classification and routing, and matures into continuous governance. The metric that connects engineering work to business accountability is cost-per-outcome: per scored interaction, per resolved call, per coaching event.
Organizations that show results at 90 days share two habits: they instrumented before optimizing, and they validated each layer in staging before release. Skip instrumentation and you cannot prove a change worked, which quietly kills the business case for the whole program.
For organizations running AI at contact center scale, ETS Labs provides embedded engineering support from baseline instrumentation through production deployment, within the 30 to 90 day timeline enterprise programs require. More at etslabs.ai/professional-services.
Frequently asked questions
What is LLM cost optimization for enterprises?
The engineering practice of reducing total inference, retrieval, and orchestration costs in production LLM deployments without degrading accuracy or compliance posture. It requires per-call instrumentation as a prerequisite and operates through four independent layers: task-based model routing, semantic caching, prompt compression, and RAG retrieval optimization.
Why are inference costs so high in contact center deployments?
Three causes: task-model mismatch, context window inefficiency, and unmetered agentic chains. Routing everything through frontier models, passing inflated context on every call, and invoking the LLM at every workflow node each generate avoidable cost. None is fixed by switching providers; all require architecture changes.
Do falling model prices solve this on their own?
No. Per-token prices for constant quality have fallen dramatically (roughly 280x from late 2022 to late 2024 by Stanford AI Index measurement), yet enterprise LLM spend keeps rising because volume, context length, and agentic call counts grow faster. Architecture determines whether price declines reach your invoice.
Does this require replacing our AI platform or model provider?
No. The optimization architecture operates at the API and event-stream layer. Existing ACD, CRM, and telephony infrastructure stays. ETS Labs, backed by Etech Global Services’ two decades of contact center operations, integrates with legacy stacks without platform replacement.
What is semantic caching and how much does it save?
Semantic caching intercepts repetitive queries at the vector-similarity layer and returns a cached response when an incoming query is sufficiently similar to a prior one. Our structured contact center workloads support 35 to 50% hit rates; published research on customer-service-style workloads reports up to 68.8% with positive-hit accuracy above 97%.
How do I calculate ROI?
Establish a cost-per-outcome baseline before any changes: total inference spend divided by completed outcomes (scored interactions, resolved calls, coaching events) for a defined period. Compare at 30, 60, and 90 days. This connects engineering changes to business accountability in a way invoice totals never do.

Related Posts
Contact Center AI: Strategic Decisions Your Organization Must Make
Six strategic decisions contact center leaders must make before choosing AI, from outcomes and augmentation…
Read More
Automated Quality Management Explained: Building QA Programs That Scale
Manual QA covers 3-5% of calls. Automated quality management covers 100%. See how contact centers…
Read More
Understanding Customer Journey: Mapping, Measurement, and Optimization
A strategic guide to customer journey mapping and measurement — how to move from whiteboard…
Read More
Contact Us
Let’s Talk!
Choose Services